#14 Irrigation mapping, Part 1: The Science that is moving us closer to global irrigation maps

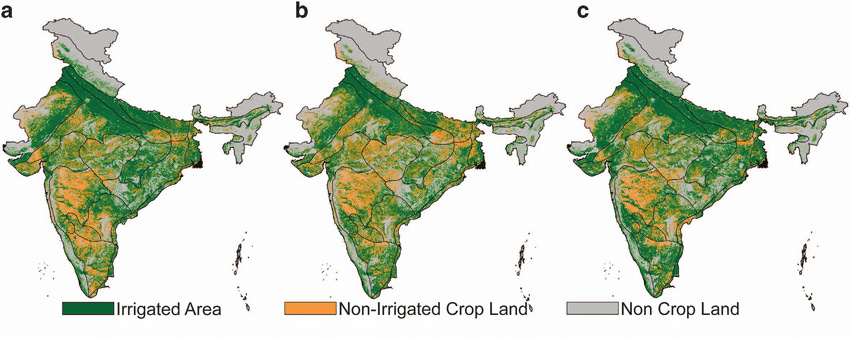
Agriculture in India is primarily rainfed and rainfall can be highly variable. Thus the absence of water represents one of the most significant risks to the business itself. The supplementary application of water via irrigation mitigates this risk. Even knowing in a binary sense (Y/N) whether a farm plot has access to irrigation can improve the certainty associated with a farm level risk score. As an example, the map below shows irrigated and non-irrigated areas in blue and brown respectively

One might wonder how these maps are developed and what their limitations and strengths are. The Irrigation + Project supported by the ESA, just culminated but not before putting out 23 publications in peer reviewed journals that have taken forward this area of study of remote sensing for irrigation by leaps and bounds. They define the scope of the problem statement as three-fold
mapping (determining the spatial extent of irrigation)
detection (beginning and end of irrigation events) , and
quantification (determining the quantum of water applied for irrigation)
In the remainder of this post we’ll cover methods applied to the mapping of irrigation, which is relatively simple and has seen multiple dozens of papers that have tackled the problem.
Irrigation maps using national statistics
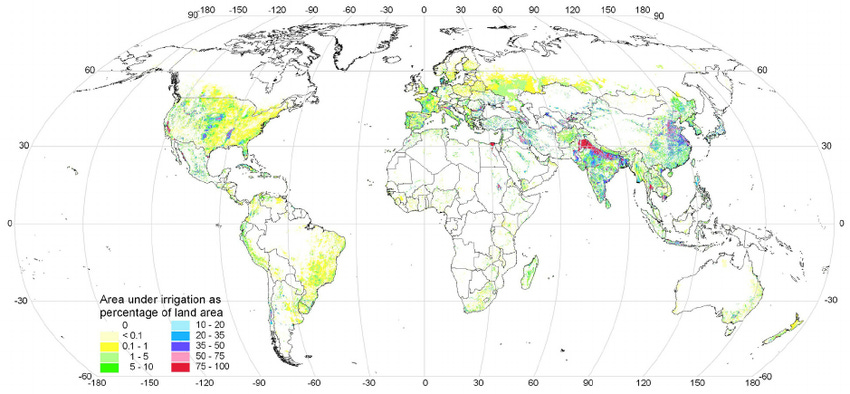
The first efforts at mapping irrigation, before the era of remote sensing relied on government prepared statistics to prepare global maps of `Area Equipped for Irrigation (AEI)`. This served as an imperfect proxy of area actually irrigated every year since these two numbers will often diverge.
The Global Map of Irrigated Areas (v5) by Siebert et al is an example, based on national statistics and even provides numbers on source of irrigation (groundwater, surface water) at the resolution of 5 arc min all for the nominal year of 2005. [1] Siebert also produced the Historical Irrigation Dataset (HID), at 5 arc min (~8km resolution) from 1900 to 2005. [2]
The first Remote Sensing derived Irrigation maps
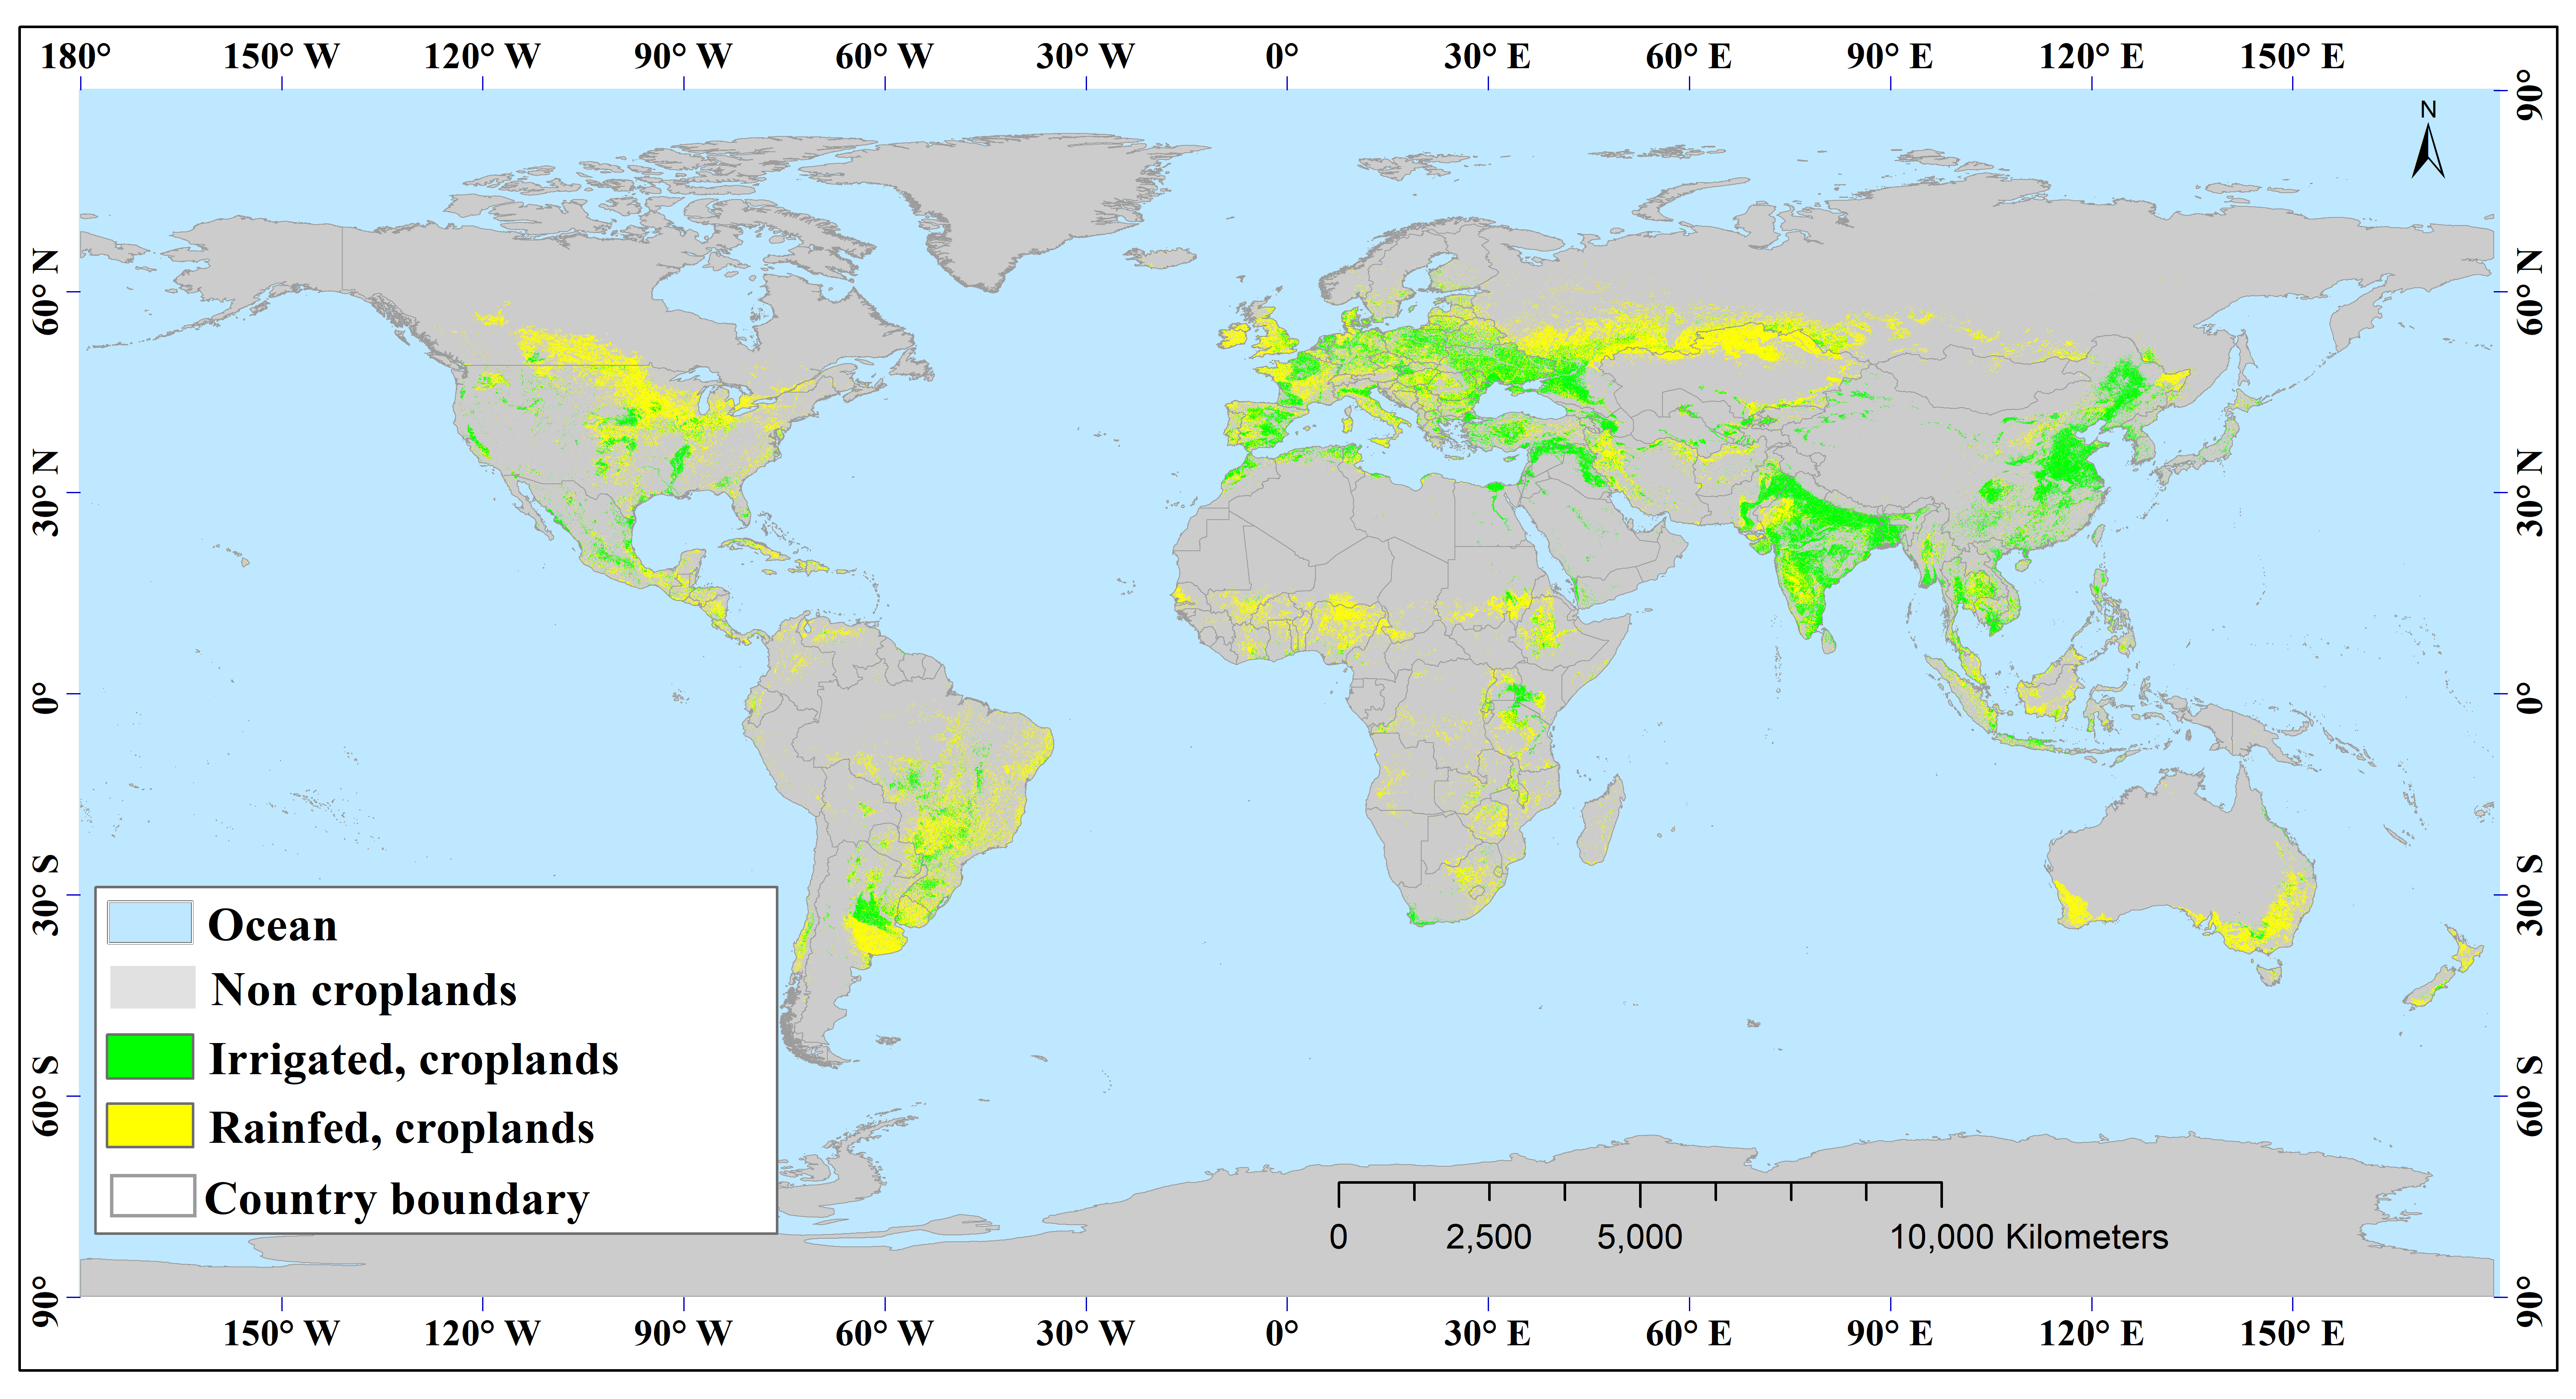
The first remote sensing based maps which contain information on irrigated area extent were Global Land Cover Characteristic (GLCC) by USGS [3] and Global Land Cover 2000 (GLC2000) [4] and ESA CCI [5] . The Global Irrigated Areas Map (GIAM) by Thenkabail et al (2009) [6] was one of the first prominent efforts focused especially at mapping irrigation. This was a 10km resolution map for the year nominal year 2000, although higher resolution 500m maps were produced for South Asia. In 2022, the same team in a monumental effort scaled up the analysis to field scale (30m resolution) maps of the global rainfed and irrigated areas (LGRIP30) for the year of 2015. The team has plans to redo the analysis every five years. Other one-off efforts at global irrigated area mapping, at moderate resolutions have also succeeded. [12]
Multi-Year Irrigation Maps
These represent one off efforts at producing maps of irrigated areas. Other efforts have produced annual irrigated area maps for many years in succession, such as the 250m spatial resolution India Irrigated Areas maps for the period from 2000 to 2015. Similarly, Global Irrigated Area maps have been produced by Meier (2018) for the period from 1999 to 2012 at ~1 km spatial resolution [11] and UCB at a ~8km resolution [9]. The LANID dataset, produced at UCB represents arguably the most advanced high resolution (30m) annual irrigated areas maps for the period from 1997 to 2017, albeit only for the U.S. [10]
The ESA WorldCereal project pushes the boundaries of irrigated area mapping with an open-source and highly scalable system with the potential to generate globally consistent maps that can be locally finetuned if users add their own training data [15]
Methods
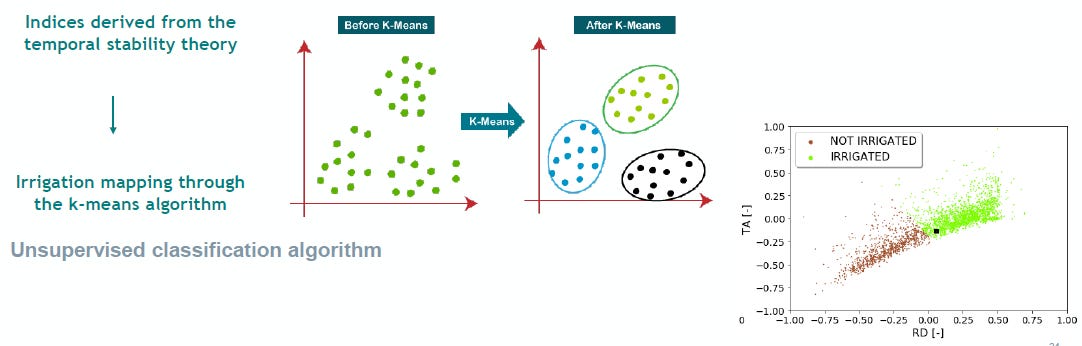
In each Irrigation mapping product, the presence or absence of irrigation is discovered, by examining an anomaly. The environmental parameter that is most closely influenced by irrigation is Soil moisture and thus intra-season soil moisture anomalies are a reliable way to map irrigation. Two prominent examples of the use of the soil moisture proxy are found in papers published through the Irrigation + project, DARI model [16] (based on temporal stability of the soil moisture signal) and the S2IM model [17] which uses both Sentinel 1 and Sentinel 2 data synergistically to produce field scale irrigation maps in Spain and Italy.
Evapotranspiration (ET) too is affected by application of irrigation, i.e. a plant that has more access to water via irrigation will transpire more. A 2017 paper demonstrated the use of Surface Energy Balance derived evaporative fraction as a basis for mapping irrigation areas using Landsat imagery. [18]
Further removed are proxies such as vegetative indices, NDVI, VCI, EVI etc. which are influenced by irrigation, but also influenced by other factors such as the availability of soil nutrients, presence of pests etc. Moreover each of these environmental proxies differ for different crop types. Thus simply seeing an evapotranspiration or NDVI anomaly is insufficient, since these anomalies could simply reflect changes in the crop type.
The India Irrigated Areas map and LGRIP are prominent examples of the use of vegetative indices, particularly NDVI. The first uses a hierarchical decision tree modeling approach based on different NDVI thresholds for different crop types and seasons. LGRIP is an example of a machine learning approach. At a high level, these maps required various high-moderate-low resolution imagery and tens of thousands of groundtruth data points to build a knowledge base for what spectral signatures of different irrigated and rainfed crops look like in different parts of the world. Landsat spectral signatures were then matched to pre-existing known spectral signatures from the database.
Limitations
Despite the problem statement being relatively easier, as compared to irrigation quantification, till date we haven’t yet seen global daily operational irrigation maps at a field scale (~30m spatial resolution or less). We’ll explore in the next post hurdles that exist to turning all the science we’ve seen above into product (operational seasonal field scale global irrigation maps / models)
References
[1] Global map of irrigated areas (GMIA) (2005), Methodology + Paper + Dataset
[2] A global data set of the extent of irrigated land from 1900 to 2005, Siebert (2015), Paper + Dataset
[3] USGS EROS Archive - Land Cover Products - Global Land Cover Characterization (GLCC) , Data
[4] Global Land Cover 2000 (GLC2000) , Documentation + Data
[5] ESA CCI - Irrigated Areas (300m, 5y) - Maps + Data
[6] Global Irrigated Areas Map (GIAM) (2009), Paper + Data
[7] Landsat derived Global Rainfed and Irrigated area Product (LGRIP30) (2023), Documentation + Data + Webpage
[8] A new dataset of global irrigation areas from 2001 to 2015 Deepak Nagaraj (2021) , Paper + Data
[9] Cropland Irrigation: Extent and Changes Over Time (2000 to 2018), UCB - Website
[10] Landsat-based Irrigation Dataset (LANID): 30-m resolution maps of irrigation distribution, frequency, and change for the US, 1997–2017. Earth System Science Data, Xie Y et al (2021) - Paper + Data
[11] A global approach to estimate irrigated areas – a comparison between different data and statistics, Meier J, (2018) - Paper + Dataset
[12] Global rain-fed, irrigated, and paddy croplands (GRIPC): A new high resolution map derived from remote sensing, crop inventories and climate data, Salmon et al. (2015) - Paper + Dataset
[13] Remotely sensed high resolution irrigated area mapping in India for 2000 to 2015, Ambika et al (2016) - Paper
[14] A new dataset of global irrigation areas from 2001 to 2015 , Nagaraj et al (2021) - Paper
[15] WorldCereal: a dynamic open-source system for global-scale, seasonal, and reproducible crop and irrigation mapping, Paper + Data
[16] Dari, J et al. Detecting and mapping irrigated areas in a Mediterranean environment by using remote sensing soil moisture and a land surface model (2021), Paper
[17] Ehsan, E et al. Irrigation Mapping on Two Contrasted Climatic Contexts Using Sentinel-1 and Sentinel-2 Data (2022), Paper
[18] Pun, M. et al. Land use classification: A surface energy balance and vegetation index application to map and monitor irrigated lands. (2017) Paper