#11 The Physics of: How we get to Soil Moisture from Evapotranspiration

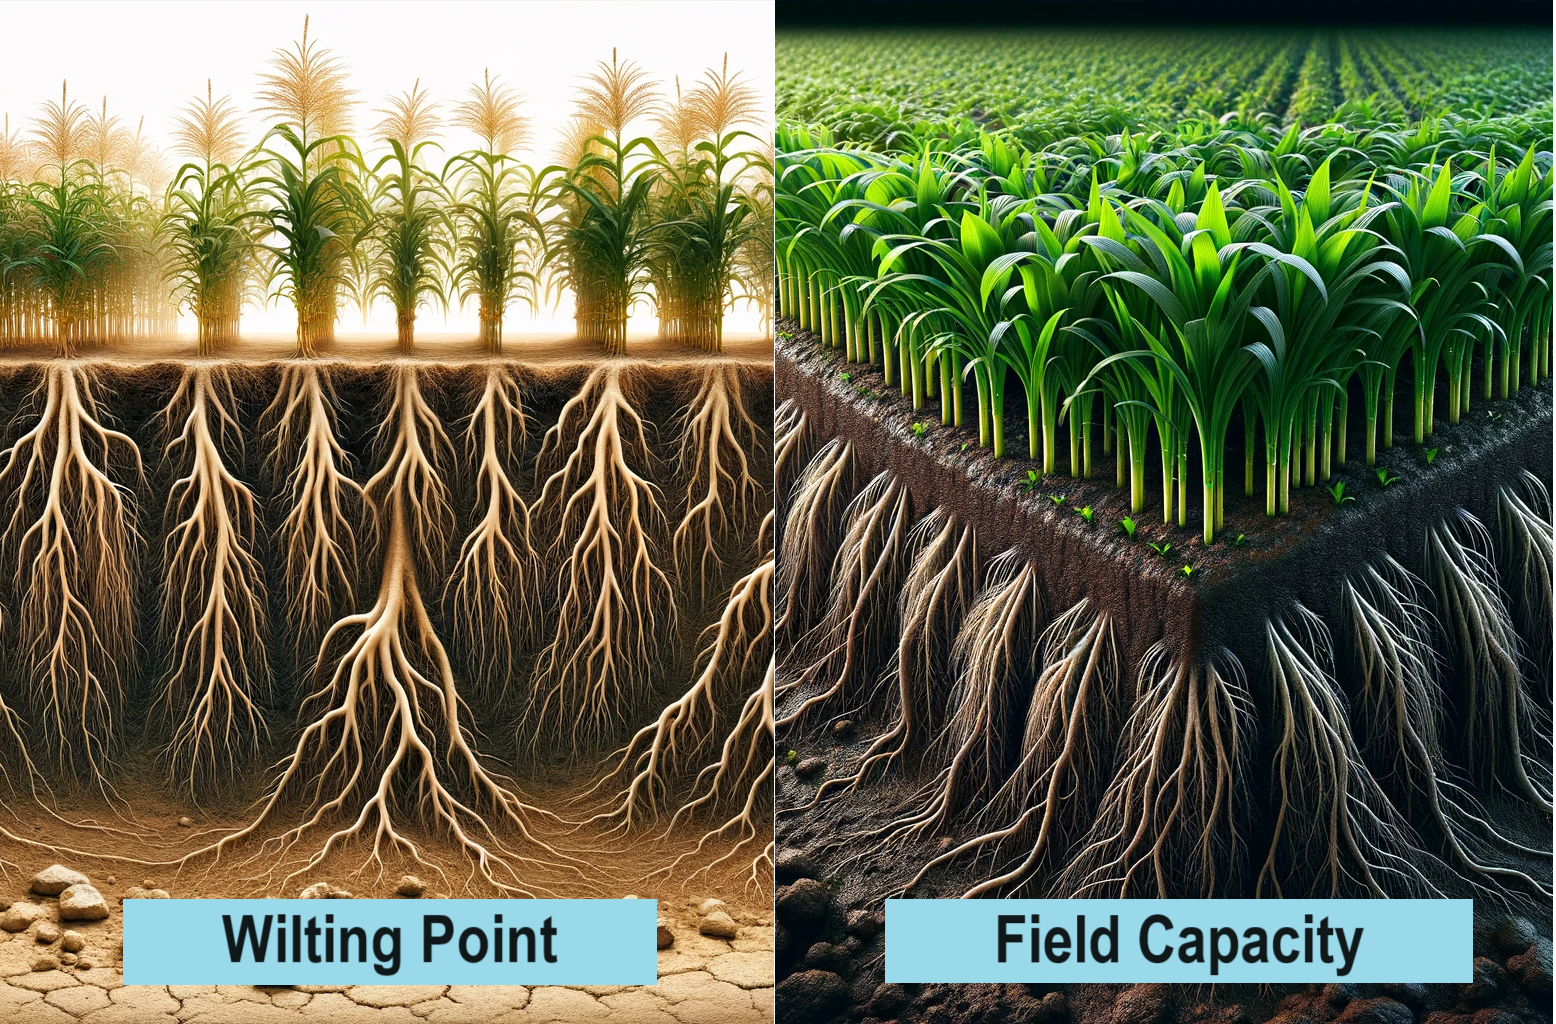
Field scale soil moisture is a fundamental variable of interest for agricultural applications. Indeed soil moisture monitoring using remote sensing is one of the oldest modes of precision farming. The theory goes as such, soil has a wilting point (ΘWP) and field capacity (ΘFC) , both specified as percentages. A typical sandy soil has a wilting point of 0.02. This means as the moisture content in the soil dips below 0.02 cm3/cm3 plants cannot easily absorb water and yield suffers. clayey soil in comparison has a wilting point of 0.05 cm3/cm3 because it holds on to water more tightly. Thus even with a higher moisture content, plant roots find it difficult to extract this water. Field capacity is the percentage volume of water stored in soil beyond which it cannot take in any more water. Any water provided to the plant above field capacity is wasted and simply runs off or evaporates away. For sandy soil this is as low as 0.15 cm3/cm3 and for clayey soils 0.3 cm3/cm3.
The primary objective of soil moisture monitoring is to ensure that moisture remains between the bounds of wilting point and field capacity at every point in the field. This requires high resolution (field scale) soil moisture remote sensing products, ideally under 30m spatial resolution. While Copernicus’ Sentinel 1 satellite has a C band radar which can be used for soil moisture applications, it typically only observes soil moisture in the upper 5-10 cm of the soil layer. However crop roots often go much deeper, upto 1.5m deep. Hence we need a soil moisture product that is representative of the entire root zone.
The Empirical Relationship
In the early 2000s Wim Bastiannssen and Christopher Scott, built on the success of the SEBAL model (which gives us Evaporative Fraction) and decades old knowledge of the empirical relationship between Evaporative Fraction and Relative Soil Moisture Content and demonstrated that Soil moisture at high resolution can be calculated using publicly available remote sensing datasets such as Landsat.
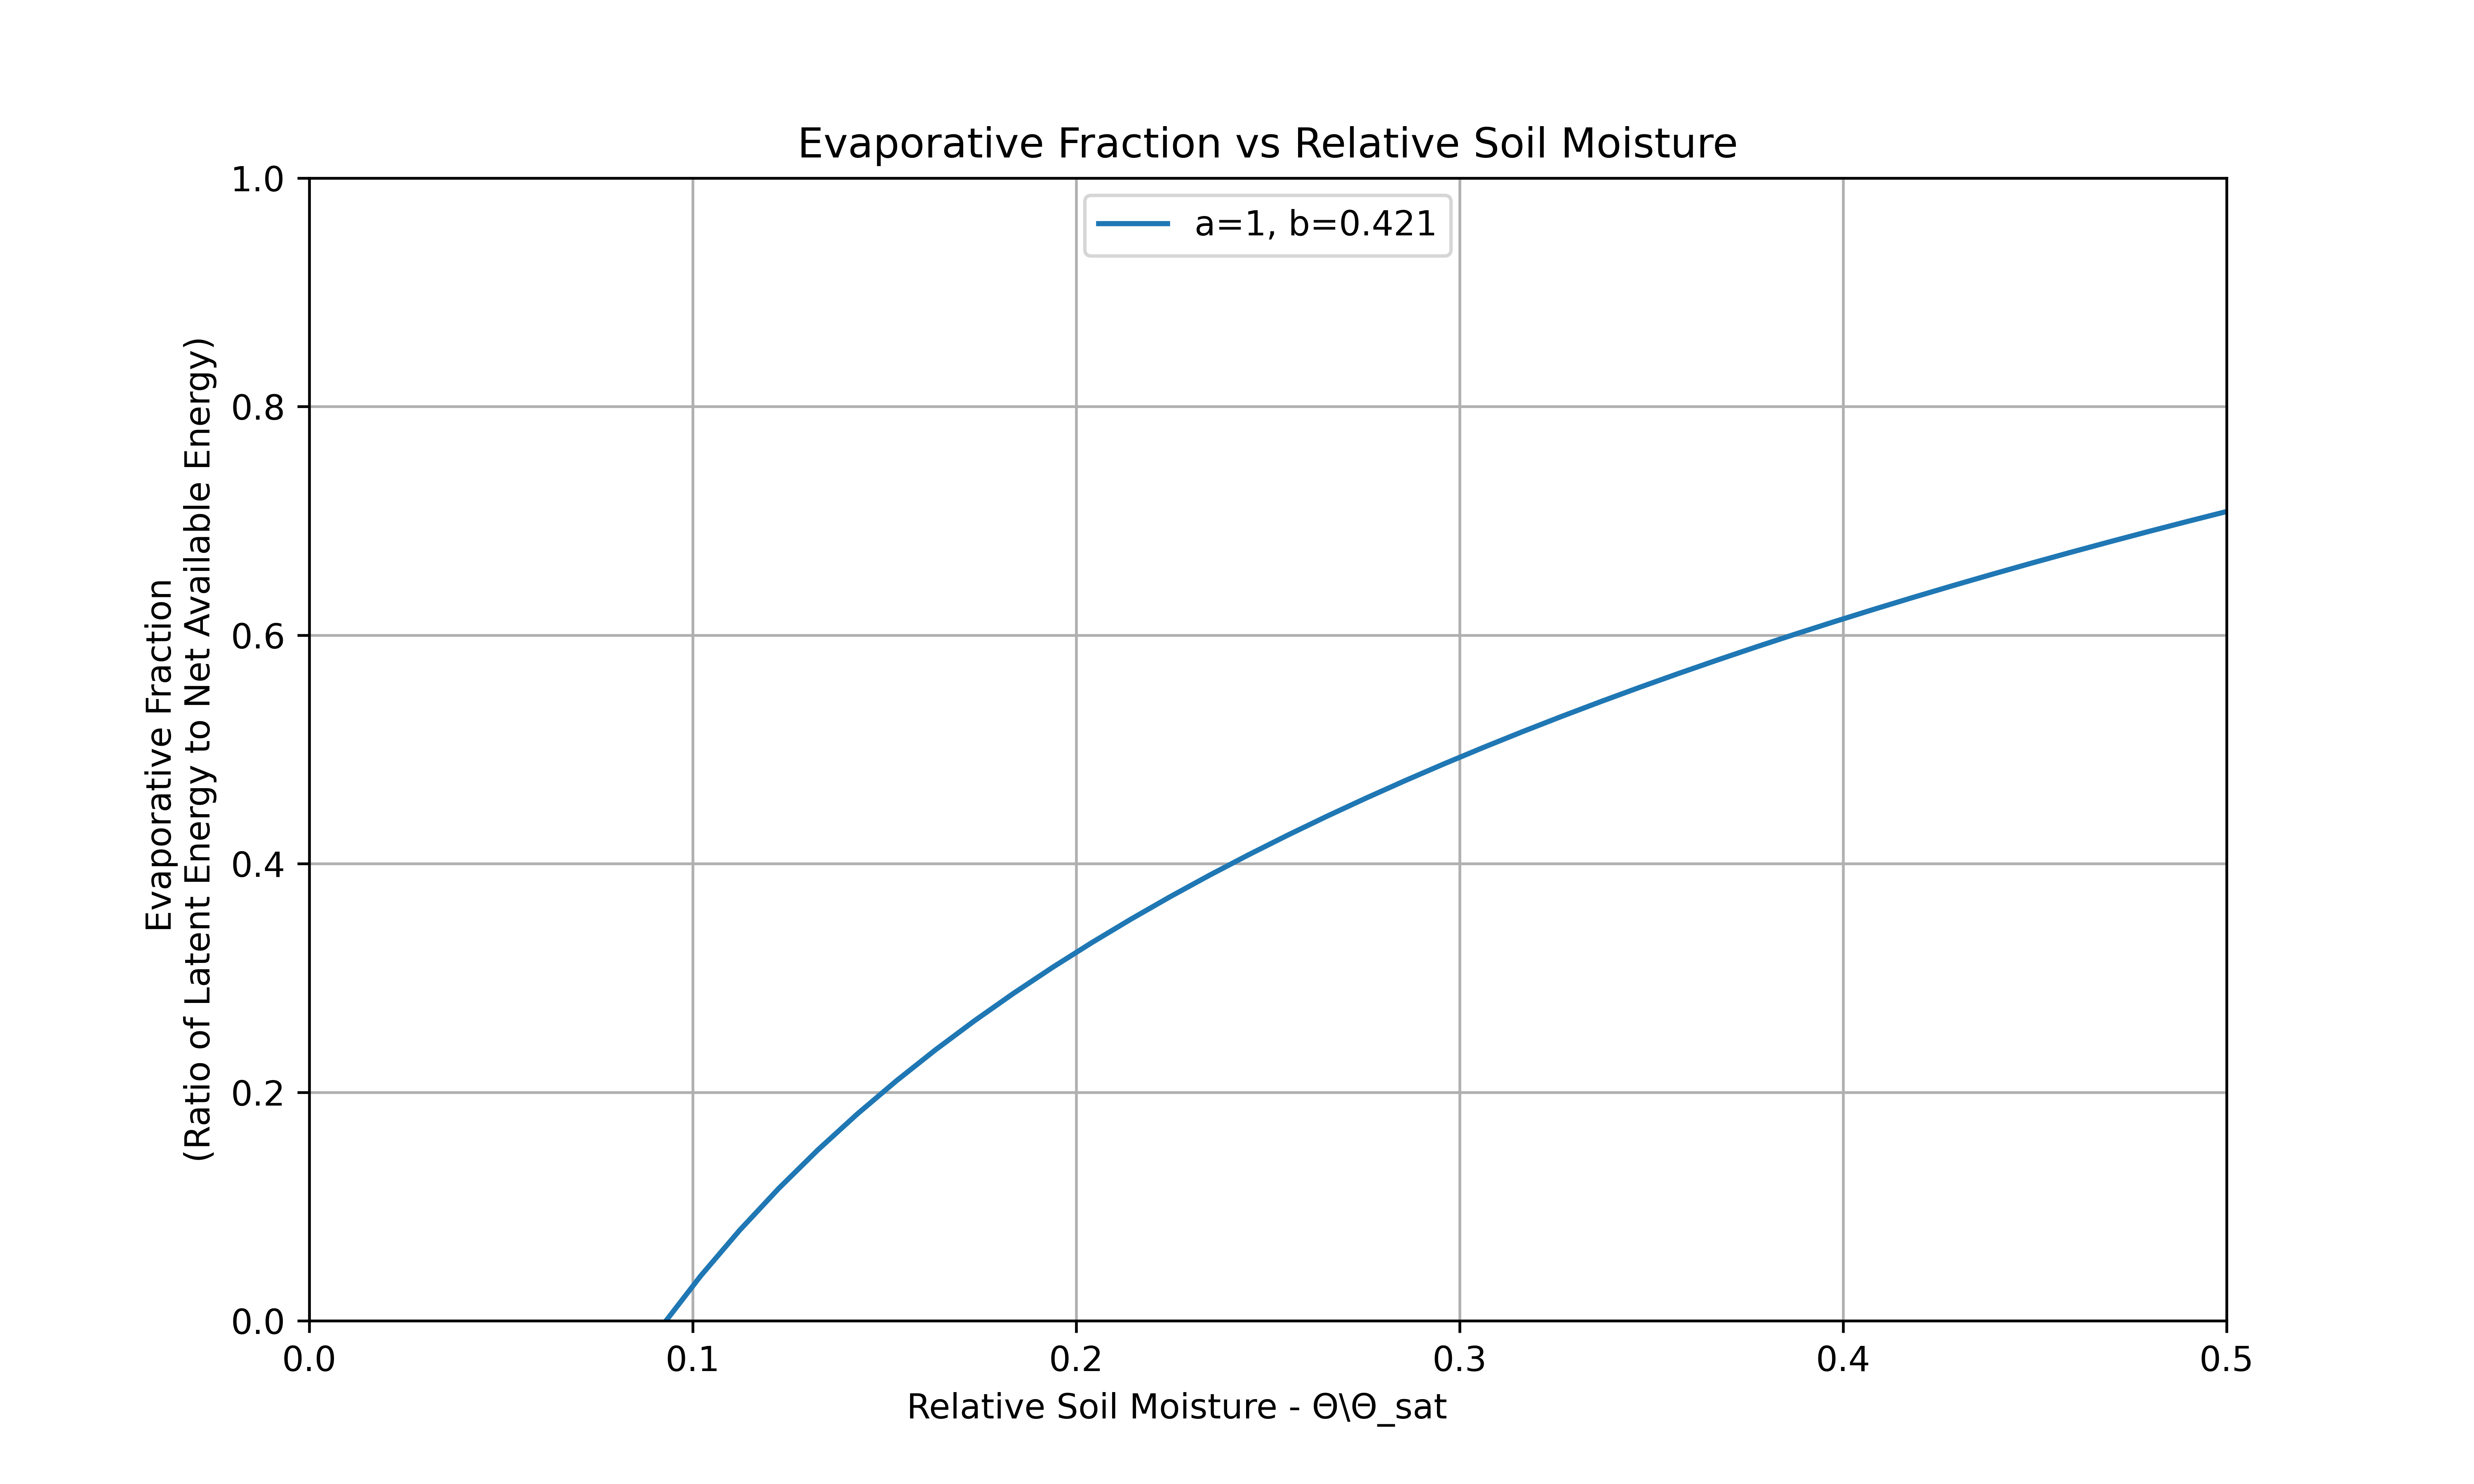
The logarithmic relationship published in Scott et al, goes something like this.
where constants a and b are 1 and 0.421 respectively and the Relative Soil Moisture is shown as the fraction of Total Soil Moisture (Θ) and Saturated Soil Moisture (Θsat)
Shuffling the terms of this equation around,
which can be shown graphically as below
In this formula, EFinst is calculated first as the fraction of Latent Energy (LE) to Total Available Energy (Rn - G).
Each of these terms follow as outputs of the SEBAL model, see post #10 for the details.

TLDR: Thus with knowledge of EF, which can be calculated based on high resolution Landsat imagery, we can estimate soil moisture too.
Accounting for Soil Type Variation
This relationship shown above is soil type independent, since relative soil moisture content normalizes soil moisture `Θ` by `Θsat` which accounts for the Saturated Soil Moisture Content for different soil types. Due to the differing particle size of different soils they each have a different percentage at which they are saturated. Clays are finer soils and have much more pore space in between to accommodate water molecules. Sandy soils in contrast have larger particle sizes and less pore space that water can saturate. Typical values for Θsat are as follows, Sandy soils (0.15), Loamy soils (0.325), Silt (0.425), Clayey (0.5).
The charts below visualize this simple relationship between Total Soil Moisture and Evaporative Fraction, for different soil types.
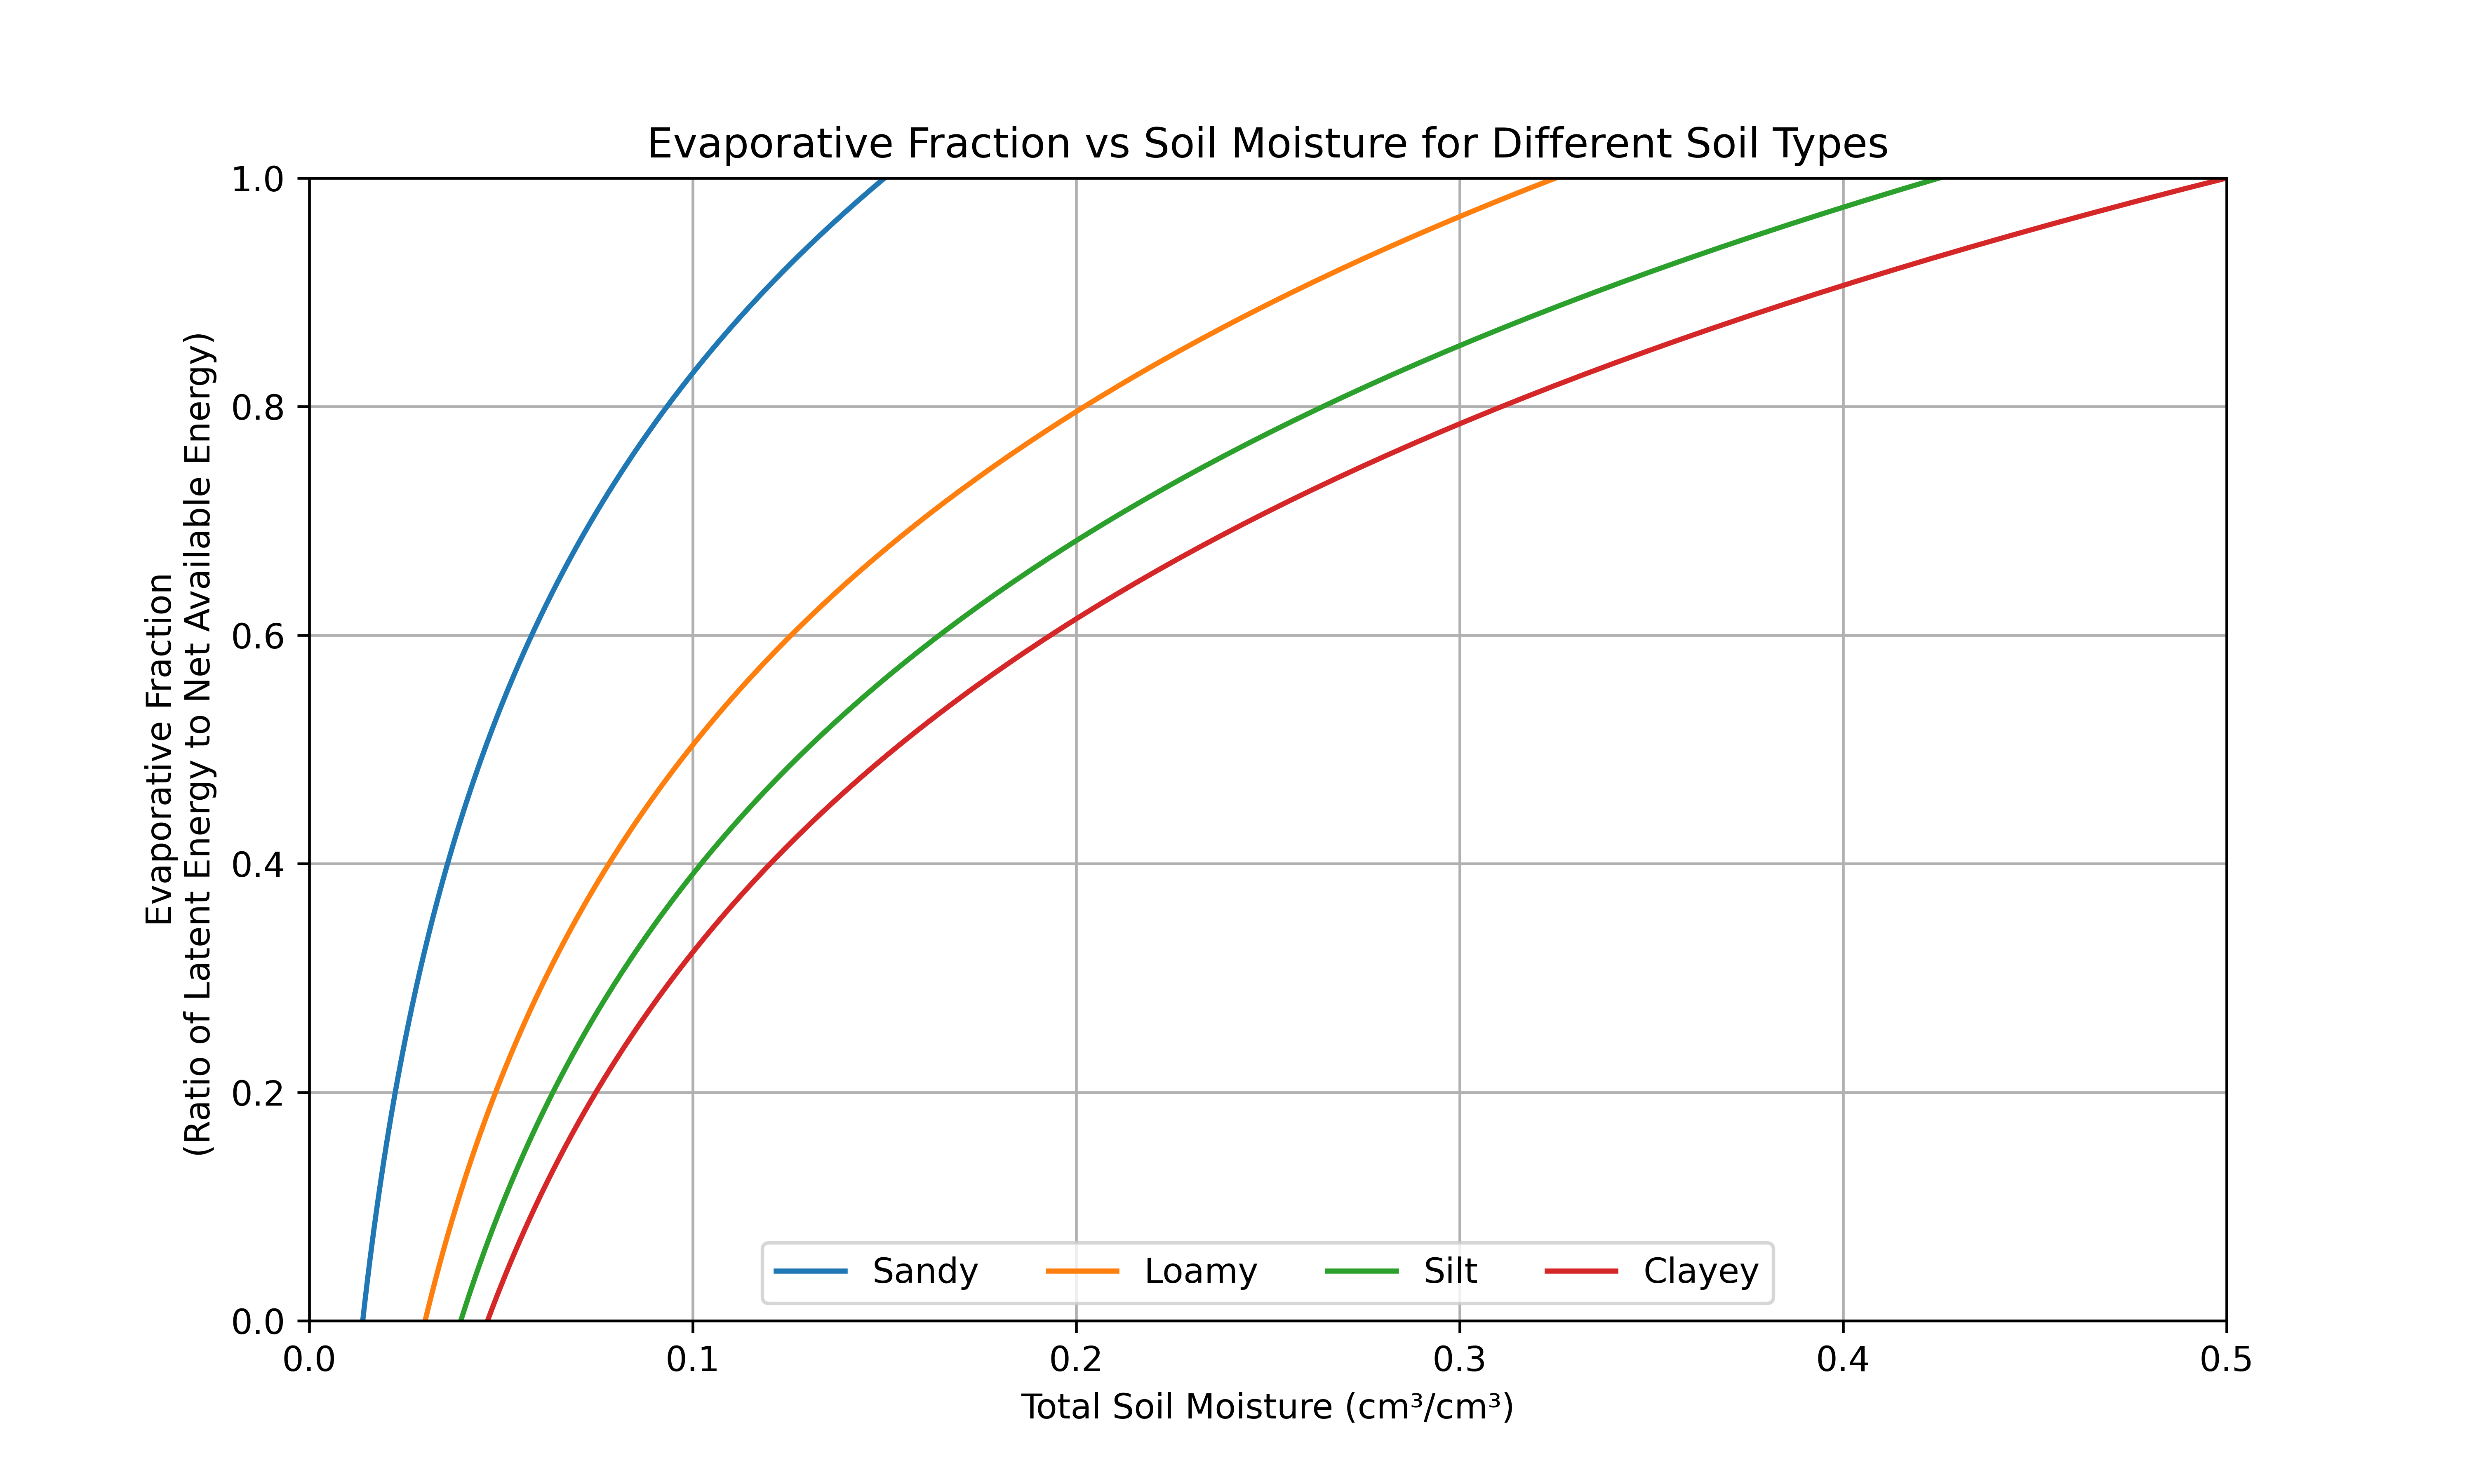
The values charted above are Total Soil Moisture. While this is the core of the calculation, these values aren’t used as is. Total Soil Moisture is converted into Root Zone Soil Moisture after taking into account extent of vegetative cover in the same pixel. This Root Zone Soil Moisture can then be used to produce regular soil moisture advisories.
Limitations
Given the inherent nature of sandy soils having lower field capacity and wilting point, this relationship will be less accurate for sandy soils since the median magnitude of error, 0.035 cm3/cm3 will mean a larger percentage error in the case of sandy soils which is more typical at higher elevations than the percentage error for clayey, alluvial soils that tend to be along streams and river banks. [1] While Scott’s original study (2003) evaluated the relationship between EF and relative soil moisture in irrigated areas in Pakistan and Mexico, further studies by Bastiannssen (2003), Fleming (2005) and Bezerra (2013) substantiated the relationship. A study in 2015 by Alburn et al evaluated the method in dry grasslands. The study found that the empirical relationship developed typically overestimate actual soil moisture and relative soil moisture and don’t generalize easily to other areas of interest. However the method is still more suited to estimate relative soil moisture rather than actual soil moisture (cm3/cm3).
Moreover, since the relationship is dependent on Evaporative Fraction (EF), any errors in measurement of EF would affect Soil Moisture estimates. EF estimates can sometimes end up outside of the 0 to 1 range, for instance in cloudy conditions or advective conditions (that occur when irrigated fields are surrounded by hot dry areas) the estimates for EF are often inaccurate. This in turn leads to poor soil moisture estimates. These challenges have prevented the scaling up of this model into a global high resolution soil moisture dataset, however if enough context is available even local estimates can prove tremendously valuable.
Applications
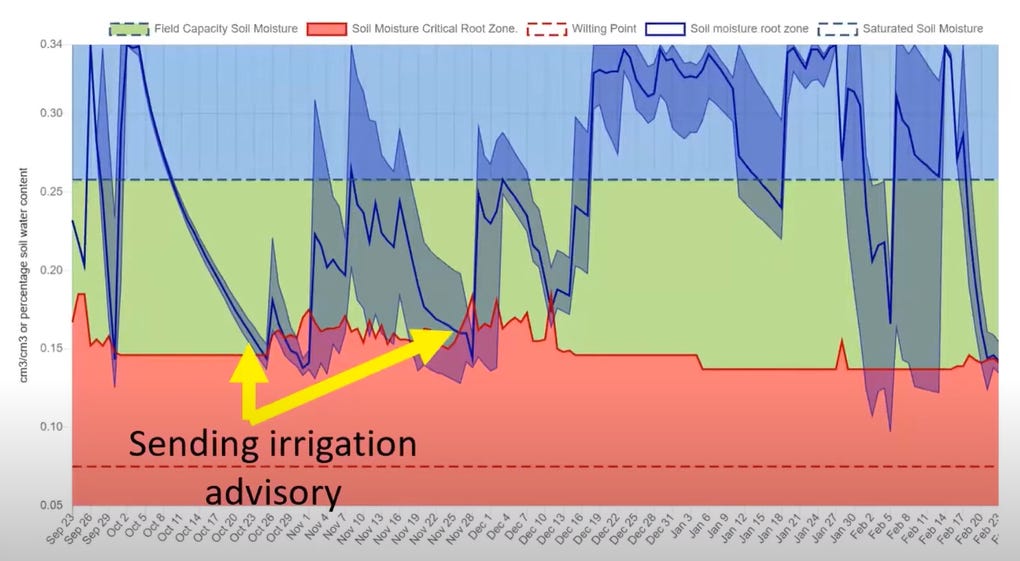
While these challenges remain, they haven’t prevented soil moisture monitoring efforts by precision agriculture companies, such as Irriwatch (started by Wim Bastiannsen) with lean technical teams , from providing farmers globally with soil moisture advisories for an economical cost of as little as $6/acre/year. The image below depicts the seasonal cycle of such advisories.
Next Week
I haven’t yet honored last week’s commitment of a deep dive into pySEBAL yet. On further reading I decided to postpone this one. Look forward to this in the new year.
Instead next week we’ll look into another critical parameter that can follow from Evapotranspiration, namely Crop Yield.
Lastly, do leave a comment below and like the post if you found it useful!
References
1] Scott et al. Mapping Root Zone Soil Moisture Using Remotely Sensed Optical Imagery, 2003